Db2 Administration: How to Break Your Cycle of Constant Firefighting and Embrace Proactive Management. Part 2
It’s time.
Time to stop the sudden spikes in your Db2 environment.
Time to stop these issues from snowballing through your applications.
Time to stop spending all of your time, energy, and attention on firefighting.
In short: It’s time to take control and proactively solve problems in your environment.
In this article, we will teach you how.
You will learn:
- What a proactive approach to Db2 administration looks like.
- What outcomes you will deliver with this approach.
- How we came to develop this approach.
- The four steps you can follow to adopt this approach.
- Some of the most common use cases that demand this new approach.
Let’s begin.
Table of contents
This is part two of a two-part series we have written on the subject.
In part one, we explored:
- The cycle of firefighting most Db2 administrators are trapped in.
- Why standard approaches to Db2 administration create this cycle.
- How you can move from reactive Db2 administration to a proactive stance.
In this second part, we will present the practical, tactical, and technical details behind our proactive approach to Db2 administration — and how to actually bring it to life.
Before we begin, a word of warning…
Our approach to Db2 administration will look a little different than you are used to.
Now, it does not throw standard approaches away entirely. But it does extend them in new directions, and fill some of the gaps and blind spots in how they operate.
Our approach to makes Db2 administration:
- Comprehensive. It extends your overall mainframe monitoring and other z/OS tasks, and expands analysis to include long-term performance data and trends.
- Collaborative. It reorients Db2 administration to focus more on your customers’ needs, and to create active cooperation among internal teams.
- Flexible. It adapts to the unique needs of each specific workload, and can work within a wide range of monitoring tools and other solutions.
- Streamlined. It automates many core performance monitoring activities, and guides remediation with objective reports and data-based recommendations.
Most important, this new approach is…
- Proactive. It shifts you out of reactive firefighting, and gives you the tools to find and fix small performance issues before they snowball out of control.
These are uncommon qualities for Db2 administration. And they deliver uncommon outcomes.
By adopting our new approach to Db2 administration, you will:
- Prevent Problems Before They Occur — Automatically. You will create a system that proactively finds and fixes the sources of unexpected performance delays and outages in your system, often without manual intervention.
- Improve Your Db2 Workload Performance— End-to-End. You will properly collect and process performance data, improving your monitoring and tuning efforts while increasing workload efficiency, effectiveness, and availability.
- Make Your Business Stakeholders Happy. You will minimize business risk and improve business continuity, all while reducing your costs, lowering your effort, and simplifying your day-to-day Db2 administration activities.
These outcomes are not theory.
We have generated them time and again by applying our approach — and we developed this approach in the real world to solve our clients’ biggest problems.
Here’s how we first developed this approach, and how you might begin to bring it to your own organization.
We work with a wide range of mainframe clients.
Our teams implement, configure, and maintain their systems and workloads.
Often, we will help our clients:
- End-to-end configure their Parallel Sysplex software and hardware.
- Install and configure z/OS components and SW products — such as CICSplex and Db2 Data Sharing — to execute these Parallel Sysplex systems.
- Leverage standard scenarios and approaches to keep their operating systems and SW products running with high continuous availability and performance.
We will also perform some SAP Workload-specific tasks, such as:
- Installing and configuring their SAP software.
- Configuring and managing their SAP Failover Support and software.
- Monitor their system health and performance using tools, reports, and logs.
In short: We handle a lot of day-to-day Db2 administration for our clients. We have seen firsthand many of the problems created by standard Db2 approaches. We have created “stable” environments that still experienced snowballing problems. And we have been firefighters manually resolving every issue that cropped up.
Eventually, we came to see there had to be a better way. Our breaking point was a standard scenario. We were working with one of our clients. We brought their system to stable operations — as defined by our statistical and activity reports. But we continued to experience problematic transactions that we had to spend all day firefighting.
So we got creative. We began to dig into the source of the unpredictable problems we were experiencing. We identified the sources of these problems and were able to respond to them faster. We began to think about how to categorize each of these problems, to automate their identification, and to minimize their risk of recurrence.
Over time, as we collected more data over longer time periods, we created scenarios for typical problems, and we found ways to automate their detection and solution.
We continuously improved our approach until — finally — we achieved our goal, and created a system that continuously, automatically, and proactively solves all of those small, snowballing problems, and better ensures a stable Db2 environment.
Here’s what that approach looks like and how to bring it to life.
Let’s be clear — our approach is complex and challenging.
In addition, we are going to outline how to bring this approach to an SAP system environment. If you are not working within this type of environment, then you might need to tweak or extend our approach to get the results you seek.
That being said, even though our approach is not simple, it is worth adopting.
To do so, you need to follow four steps.
- Step One: Establish Performance Baselines
- Step Two: Perform Continuous Monitoring
- Step Three: Identify Performance Problems
- Step Four: Evaluate and Implement Changes
Let’s explore each step in greater depth.
First, you have to establish a baseline for your performance evaluations.
With this baseline, you will be able to detect the development of aberrations that indicate new bottlenecks and performance deficiencies.
You will also use this baseline to evaluate the impact of any tuning activities that you perform and to determine whether your actions worked or not.
To create this baseline, you must collect and store long-term performance data.
You must also collect and store performance data both before and after you perform any tuning activities.
Next, you must continuously monitor your environment for changes.
We build our basis for performance and security reports around a few sources.
We use System Management Facilities (SMF) records as a major source of trace data witten by z/OS and SW products like Db2 or CICS. SMF collects and records system and workload related information about CPU usage, direct access volume activity, configuration, system security, and other system resources and application activities. We use different SMF records for performance and for security.
We feed SMF records — among other data sources — into a few monitoring tools.
One is the Resource Measurement Facility (RMF), which collects data for long-term performance analysis and capacity planning. It provides experts with easy access and visibility into the many data types across the full z/OS infrastructure.
Another is IBM Omegamon for z/OS. We use it to monitor and manage both the performance and availability of individual z/OS systems, and the workload performance and resource utilization of relevant Parallel Sysplexes.
We also use our own IBA APPULSE for z/OS.
In addition, we use RMF reporting for Enclaves to determine which transactions are performing well, and which seem to be hogging resources.
And we use Omegamon for Db2 for a range of monitoring activities:
- To provide system performance health on the Db2 database level.
- To run accounting reports that provide usage data on the workload level.
- To run exceptions reports that alert us when a transaction exceeds defined thresholds.
- And for Performance Database Tables (PDB) to visualize trends and make predictive decisions.
Finally, we have found that sometimes you can get useful long-term data from running customized SQL queries to regularly select a snapshot of a dynamic statement cache data — for selecting from DSN_STATEMENT_CACHE_TABLE and from customized SQL — and to collect these snapshots, to aggregate them, and to look for trends. This is very specific to Db2 but it is useful in certain contexts.
Ultimately, we use these systems and data sources to run and store a number of automated reports.
After we establish those systems and sources, we have a good picture of what’s happening in the Db2 environment.
By analyzing the appropriate RMF reports, we are able to find and fix issues in our Parallel Sysplex configurations and our application transactions.
Our RMF III Interactive Performance Analysis and SMF records allow us to analyze systems and identify their delayed workloads and identify the reasons for the delay.
To develop a more comprehensive view of potential problems, we typically run multiple reports for the same time period and combine them. For example, we combine RMF and Omegamon reports, batch and online reports, as well as history reports — based on SMF records — to get to the bottom of an issue.
When we do, we are always looking for instances of indicators above normal values. Things like:
- High CPU usage
- High I/O usage
- Delays
- Or coupling facility indicators
By doing so, we typically achieve two goals:
- We are able to identify the root cause of performance issues. With these reports we have everything we need to determine the reason for performance issues — including past performance issues — and we can see what corrective action we must perform to remediate the live issue ASAP.
- We produce evidence of the performance issue to report to our stakeholders. These reports allow us to produce and present clear before and after reports that — when compared to each other — make it very clear what the source of the performance issue was, and how to remediate it.
One last thing for this step — it’s essential to define and adjust the Workload Manager (WLM) performance goals for each workload based on your business’ needs.
By doing so, you solve a number of potential problems upfront.
You ensure critical workloads are executed in the right priority.
You define, implement, and adjust workloads based on your business needs and your SLAs.
You prevent different classes of transactions and workloads from interfering.
And you avoid flagging high-resource — but critical — workloads during monitoring.
Finally, you will tie the past three steps together to remediate issues quickly.
You will use your reports to define the root cause of any issue you encounter.
You will then produce evidence of the report to convince others of your findings.
You will define cost-effective solutions to the issue.
You will look at your data to predict the impact of implementing each solution.
You will select the right solution and implement it.
Finally, you will compare your before-and-after data to evaluate the actual impact of the solution. You will determine if it worked or not, and you will be able to report to your stakeholders exactly what happened and how to prevent similar issues from occurring again.
By now, you likely see a few places you can adopt this approach in your organization.
In our own work, we typically leverage this approach for two high-level use cases:
- To set policies in WLM for workload management.
- To identify and address our client’s common performance issues.
To illustrate this work, let’s dig into a few specific use cases.
They are:
- Use Case One: Defining Performance Goals in WLM
- Use Case Two: Identifying CPU Usage Anomalies
- Use Case Three: Query with a Bad Access Path
- Use Case Four: Massive Modifications and Global Locks
Let’s look at each in greater detail.
It is important to analyze multiple elements of our Db2 workload, as well as other workloads, batches, and address spaces running on your systems. You must then define corresponding Service Classes in WLM with the appropriate priority, response time, and velocity for each.
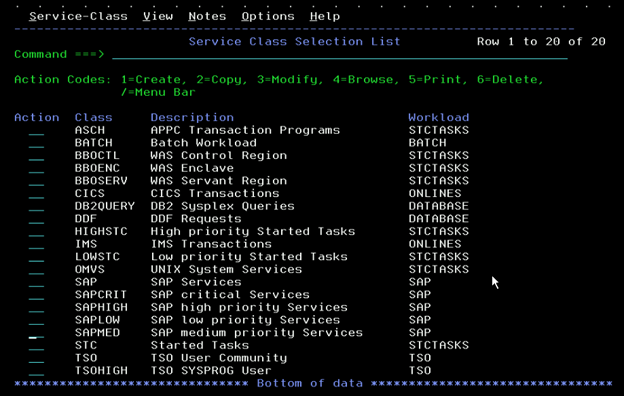
In this example of a workload and Service Classes setup on the Parallel Sysplex, the SAP workload is set as higher priority than the others — including the CICS/IMS online transactions, other DDF workloads, and batches.
Note that SAP is not a pre-defined workload in WLM. We set it up from scratch using SAP recommendations and had to adapt a lot of it based on this client’s business tasks that were specific to their SAP systems (and based on our own experience with long-term tuning of these systems.
Here are those Service Classes for SAP workload.
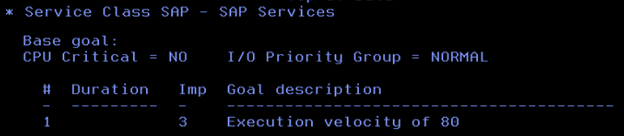
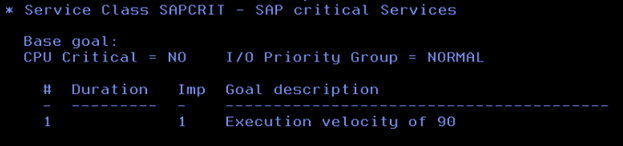
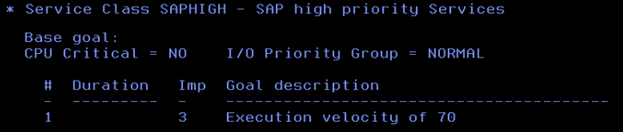
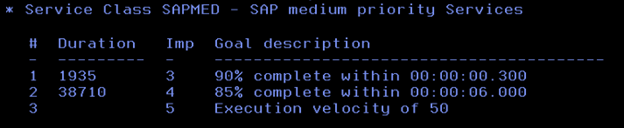
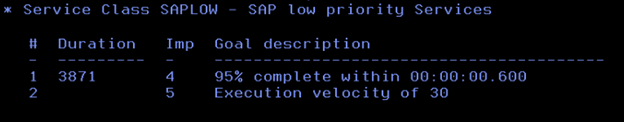
Here, the classification rules are mainly defined based on the Correlation Name of the DDF workload, so we assigned the appropriate Service Class to each of the different types of SAP workloads.
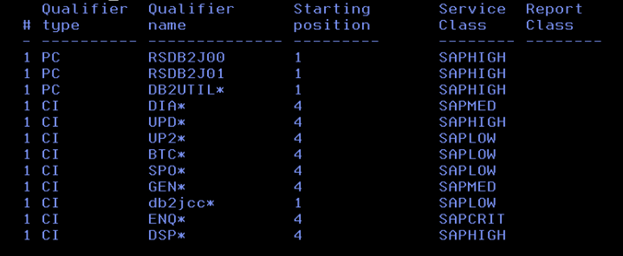
When you assess your system with this setup of WLM goals, you will know it’s performing well by looking at the Performance Indicator in the RMF monitor.
In a well-performing system, the Performance Indicator will be about 1 during peak hours, and less than 1 during calm hours. It can exceed this goal a little bit for a short interval as long as it returns to normal. It’s also ok if it’s caused by other sources and not really impacting the SAP workload. But if the system is in the red zone for a long period of time then you know there’s a problem and must review your performance goals.
Also note that WLM dynamically updates Dispatching Priority (DP) for the address spaces, as well as for DDF workloads (which are moreover zIIP eligible and runs in enclaves).
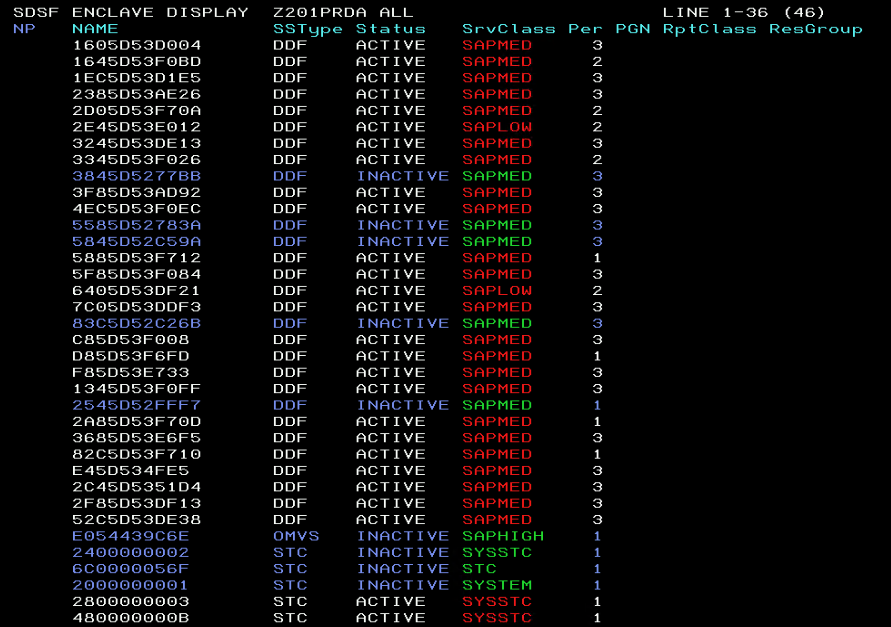
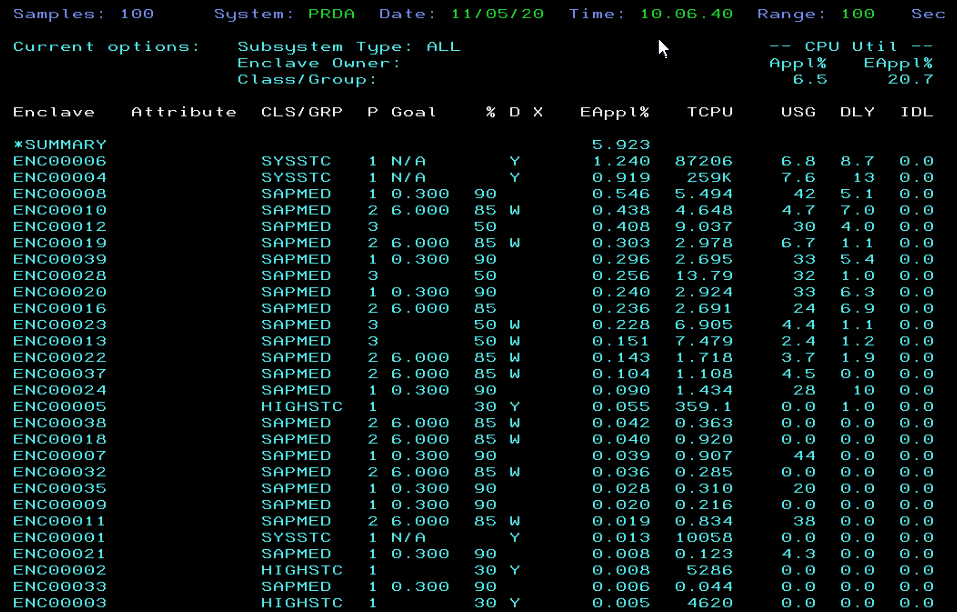
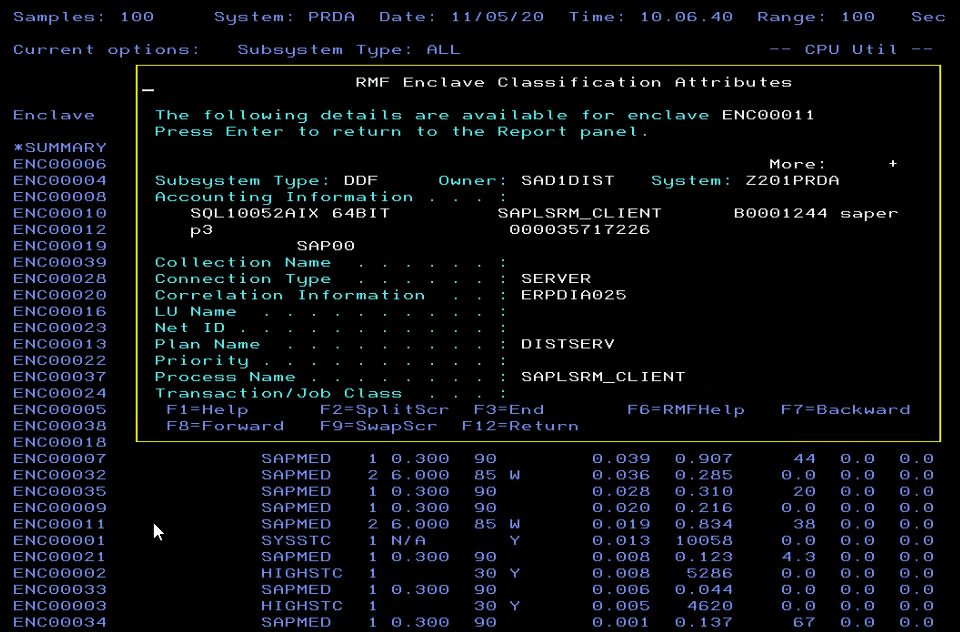
In the RMF Enclave Report, you will also find CPU consuming enclaves that are associated with SAP transactions, as well as delays.
You can drill down to find more details of each delay’s reasons.
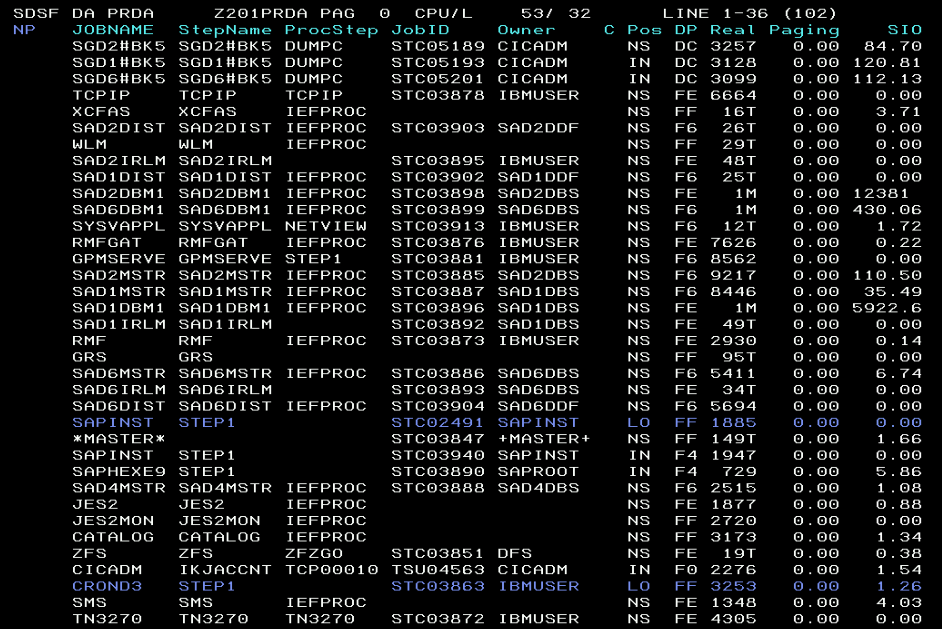
Here you see “black and green” 3270 terminal screenshots from RMF, SDSF, and WLM.
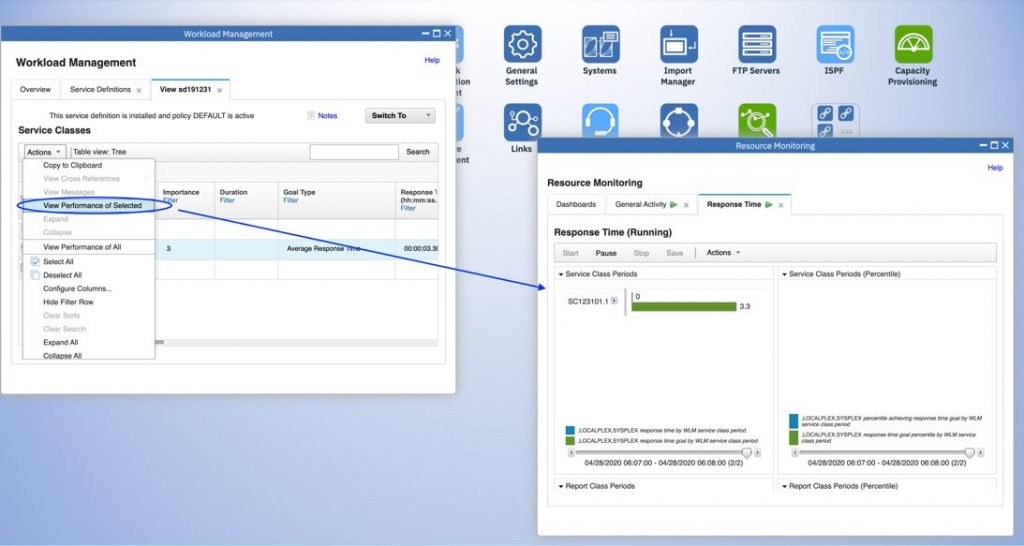
It’s not accurate to say that a modernized browser-based z/OSFM web-UI helps people to manage z/OS. It’s better to use z/OSMF browser-based plugins for Sysplex management for RMF, SDSF, and WLM.
Here are a few graphs showing long-term peaks of excessive CPU usage for CP/SE.
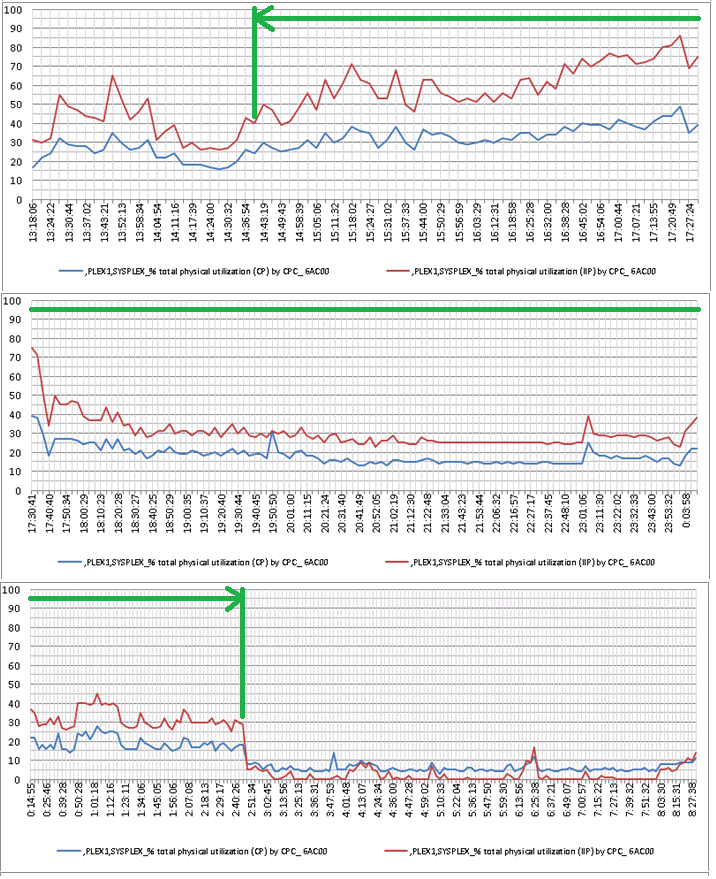
See that anomaly?
In this example it’s worth checking to see if we have seen it — or something similar to it — before. After all, it might be something like a huge quarterly close process or a massive resource consumer.
Whatever it is, this graph shows us that 30 – 40% of CPU/zIIP was constantly being consumed to execute something.
If you check your regular Omegamon Exception Report, you will likely see it in your Top 10 CPU consuming processes.
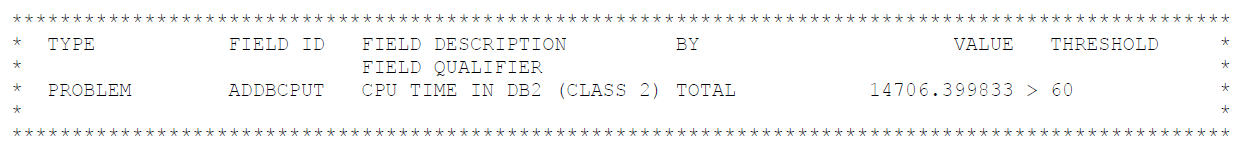
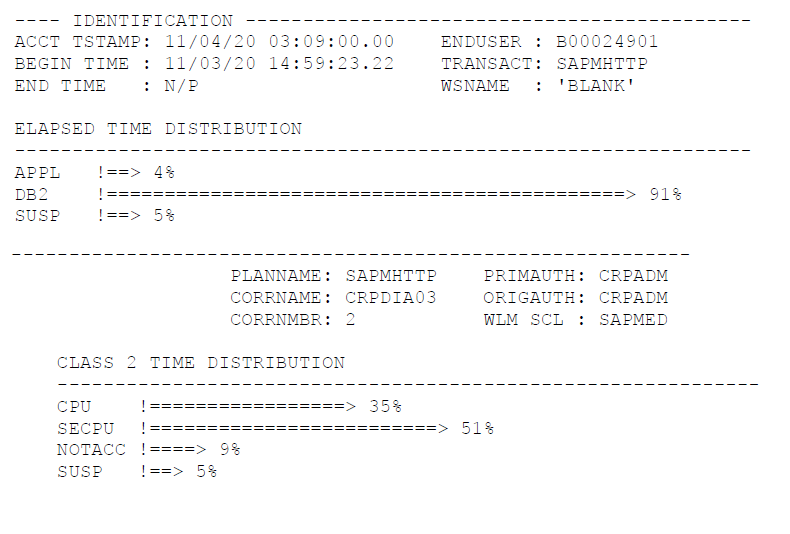
By checking this report, we see that there was a long execution of the SAPMHTTP program. It was initiated by user B00024901. The program was executed on both PRDA and PRDB members. It took 12 hours to fully execute.
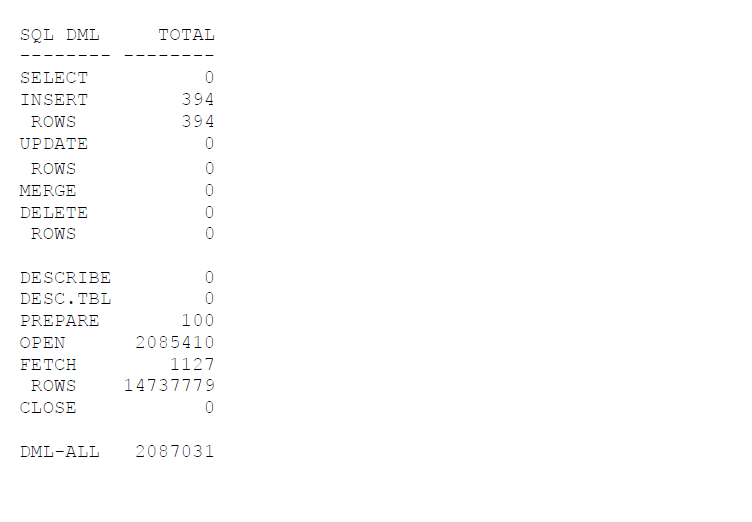
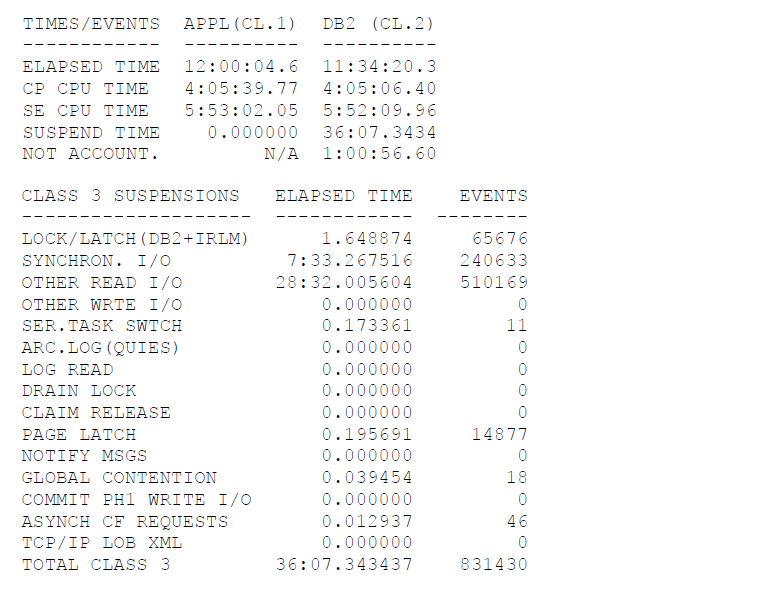
We also see a number of data modifications and huge volumes (14+ M) data rows fetched at a large CPU and I/O cost.
In this example we may not know the business logic — and we cannot distinguish if this is a performance problem or an incorrect user action. But we need to check it ASAP because — whatever it might be — it does not look like normal performance.
We need to find out what it was, why it was running, whether it was human error or a performance problem… and what we can do to resolve it ASAP.
While we check with the stakeholder about these issues, we can also analyze the problem further and extract the exact SQL with the highest cost from the Cache of Dynamic SQLs:
SELECT T_00 . “HEADER” FROM “CRMD_ORDER_INDEX” T_00 INNER JOIN “CRMD_ORDER_INDEX” T_01 ON T_01 . “CLIENT” = ? AND T_01 . “HEADER” = T_00 . “HEADER” WHERE T_00 . “CLIENT” = ? AND ( T_00 . “PROCESS_TYPE_IX” IN ( ? , ? , ? , ? , ? , ? , ? , ?) OR T_00 . “PROCESS_TYPE_IX” BETWEEN ? AND ? OR T_00 . “PROCESS_TYPE_IX” BETWEEN ? AND ? OR T_00 . “PROCESS_TYPE_IX” BETWEEN ? AND ? OR T_00 . “PROCESS_TYPE_IX” BETWEEN ? AND ? OR T_00 . “PROCESS_TYPE_IX” BETWEEN ? AND ? ) AND T_00 . “TEMPLATE_TYPE_IX” = ? AND T_01 . “DATE_1” BETWEEN ? AND ? FOR READ ONLY WITH UR
We can see here the database is taking so much CPU time to execute queries to the crmd_order_index table.
And if we combine the crmd_order_index table with itself we can see the strangest and most resource-intensive request is the header.
From here we can check with the developers to determine the purpose of this SQL query. In SAP the query may have been generated from ABAP code and may not be fully controlled by the developer, so it is good to check with them and show them this SQL which they might never have seen before.
On our side, we will run Explain for the query, check its access path in Db2, verify if the Db2 object maintenance would help, and give the developer recommendations regarding indexes or query code updates.
Remember — even one small request can ruin a seemingly stable environment.
In this case, there is an incident with the TBTCO table and the RSBTCDEL2 ABAP program, which deletes background jobs from the SAP system.
It runs this SQL query:
SELECT “JOBNAME” , “JOBCOUNT” , “SDLSTRTDT” , “SDLSTRTTM” , “SDLDATE” , “SDLTIME” , “SDLUNAME” , “STRTDATE” , “STRTTIME” , “ENDDATE” , “ENDTIME” , “PRDMINS” , “PRDHOURS” , “PRDDAYS” , “PRDWEEKS” , “PRDMONTHS” , “PERIODIC” , “STATUS” , “AUTHCKMAN” , “JOBLOG” , “EVENTID” , “EVENTPARM” , “RECLOGSYS” , “RECOBJTYPE” , “RECOBJKEY” , “RECDESCRIB” FROM “TBTCO” WHERE “STATUS” = ? AND ( “ENDDATE” < ? OR “ENDDATE” = ? AND “ENDTIME” <= ? ) FOR READ ONLY WITH UR FETCH FIRST 1000 ROWS ONLY
This query is frequently executed and was suddenly switched for Db2 for a table scan access path.
While it is a small table and small query, SAP runs it regularly to see if a job has been completed and is ready to be deleted.
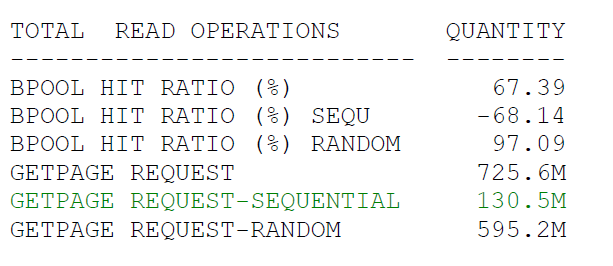
Using the STATISTICS reports for the past and current week, we found a significant increase of GETPAGE REQUEST-SEQUENTIAL which caused a noticeable increase in CPU usage.
Before:
 After:
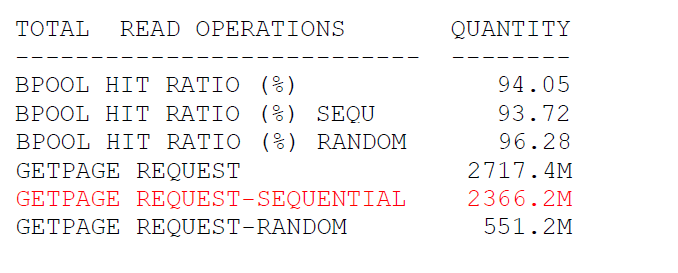 This reported performance degradation affects everything in the system and must be solved. Just one query was able to increase GetPages on sequential operations and decreased the overall hit ration for Dynamic Prefetch.
And this was not the only problem.
Deletion processes became longer and were not completed in time.
More and more new incoming RSBTCDEL2 programs appeared in the system holding locks on the TBTCO table.
The problem was snowballing.
Thankfully, it had a simple solution — Cancel all occurrences of RSBTCDEL2 programs, reorganization, and statistics on TBTCO table for getting a better access path.
Look at the following message.
Never ignore messages like this.
They always require attention, especially if you run Rb2 workloads in Db2 Data Sharing:
DSNJ031I B# DSNJW001 WARNING – UNCOMMITTED UR HAS WRITTEN 3000000 LOG RECORDS
When this occurs you have a transaction that is performing massive data modifications, and might be for one particular Db2 table.
In SAP, in some cases we recommend Locksize Tablespace. While it violates SAP rules for Db2 table options, we have found it useful as an exception in some cases, such as when user tables have a huge amount of data modifications all at one time.
If you are unable to change the SAP recommended option — which is Locksize Row/Page — then it might produce lots of messages sent via Coupling Facility links, and potentially cause global lock contention and intensive usage of lock structures. It can consume a lot of CPU to resolve lock contentions. Avoid this approach when possible.
Instead, we apply a technique like this:
- We use monitoring tools to identify transactions that are producing a huge amount of global locks.
- We notify the developer about the risk of global lock contentions.
- While the transaction code is being redesigned, it is executed under control in dedicated timeframe that are as isolated from concurrent transactions as possible.
In advance, we schedule the following command:
-ACCESS DATABASE(DSN08061) SPACENAM(ZBUT0000) MODE(NGBPDEP)
This helps with global locks. When a Db2 data set that is open for read/write access has gone for a certain interval of time without any data changes it will be pseudo closed. The interval of time depends on a number of checkpoints or a number of minutes set in zPARM parameters.
This means your transaction can be the only one which acquires locks, runs isolated, but still propagates those local locks to global locks.
This command will release the read/write access state.
Db2 will then switch the data set’s state to read-only.
This is an example of a TEP Alert on a huge amount of global locks:
MON_Alert: BB_ZOS_List_Entries_Warning ON DB2plex
Incident on Server: DB2plex
Severity: WARNING
Situation: BB_ZOS_List_Entries_Warning
Display Item:
Message Text:
BB_ZOS_List_Entries_Warning[(List_Entries_Used>200000 AND Structure_Type=LOCK AND STRSCAN(Structure_Name, “SGD”) = 1 AND STRSCA=1 AND STRSCAN(Structure_Name, “_LOCK1”) = 1 ) OR ( KDP=1 OR List_Entries_Percent>15 AND Structure_Type=LOCK AND STRSCAN(Structure_Name, “SGD”) = 1 AND STRSCA=1 AND STRSCAN(Structure_Name, “_LOCK1”) = 1 ) )
Attributes:
structure_name = SGD6_LOCK1
data_sharing_group = SGD6
list_entries_used = 555829
false_contention = 589050
global_contention = 4562749
lock_entries_used = 598016
list_entries_allocated = 1354408
lock_entries_allocated = 67108864
We hope our explanation of this new solution — and our explication of these use cases — makes one point clear…
You don’t have to remain in a state of constantly firefighting issues in your Db2 environment.
You can uncover small, unexpected issues and resolve them before they snowball out of control and create much bigger issues.
We worked to present this approach as simply as possible, but we understand that you may require some guidance to bring it to life in your organization.
If you do, reach out today.
Schedule a free chat, and we will:
- Review your Db2 workload, receive recommendations, and try APPULSE.
- Ensure your upcoming code changes don’t impact your performance.
- Modernize your legacy business applications, techniques, and processes.
- Adopt predictive and proactive Db2 workload management.
- Apply our new solution to your system.