Integrating Power BI into E-Commerce: How to Succeed in Rapidly Developing Markets
Table of contents
The lightspeed development of information technology has changed not only people’s lives, but also corporate approaches to business. Recent years have seen a fundamental shift in retail, from selling products and services in brick-and-mortar stores to selling in online marketplaces deployed on special platforms (e.g.: Shopify, WooCommerce, Wix, Mageto, etc.). COVID-19 only accelerated and solidified this trend.
Success in e-commerce depends on understanding market conditions and changes. What will become a trend in the near future? Who are your target customers? What are their preferences? What are your competitors doing, and how do they interact with buyers? How relevant are your goods and services compared to your competitors?
Answering these questions is challenging. Business Intelligence (BI) systems make it simpler. In this article, we explore the power of BI, focusing on a perennial market leader: Microsoft Power BI.
Advantages and Drawbacks of E-Commerce
“E-commerce” refers to the distribution, promotion, and sale of goods and/or services via the Internet. For customers, the main advantage of e-commerce is convenience. They can easily compare different companies’ products, read reviews before making a purchase, place orders and arrange deliveries at convenient times, and pay for it with their preferred method.
In turn, companies get to minimize red tape and simplify business processes. They can also analyze and improve their customer service, anticipating customer behavior and proactively designing better experiences.
However, with this ease comes more players into the market, and of course, more competition. To succeed, managers must always have detailed, up-to-date information enabling them to make quick strategic decisions, regulate marketing and SMM costs, and retain customers through flexible loyalty systems.
Problems arise when companies store data — about sales, customers, marketing costs, and other expenses — in disparate sources and diverse formats. It slows down reporting and reduces its accuracy. Employees must manually upload and consolidate data, then calculate KPIs that may reflect previously unprocessed raw data. In the end, employees only receive one-time reports and need to repeat the process any time they want to process new information. The reporting mechanisms embedded in the above-mentioned e-commerce platforms offer minimal functionality.
Relying on these limited, outmoded processes produces poor decision-making.
However, if you make the most of your data, transforming it into actionable information, you can improve customer satisfaction and boost your competitiveness. Only specialized BI systems can automate the collection, analysis, and presentation of your data.
How BI Helps
BI systems provide myriad business benefits to employees and managers throughout an organization. Through automated processing and intuitive reporting, employees can research data, answer questions, draw important conclusions, and make meaningful decisions.
BI systems process and consolidate large data sets from multiple sources. They use both historical and current data to obtain valuable analytical information, then present results in easy-to-understand forms (tables, graphs, charts, maps, etc.). BI systems let users identify pain points, analyze and forecast sales, anticipate customer behavior, find potential customers, develop competitive strategies, and adapt to changing markets.
Companies use many BI platforms to develop analytics applications. Microsoft Power BI, Qlik (QlikView, QlikSense), Tableau, Sisense, and IBM Cognos BI are some common examples. Companies choose the tool best suited to their needs — including hardware capacity, licensing policy and many other factors — and make them fundamental to management decisions.
Why Microsoft Power BI?
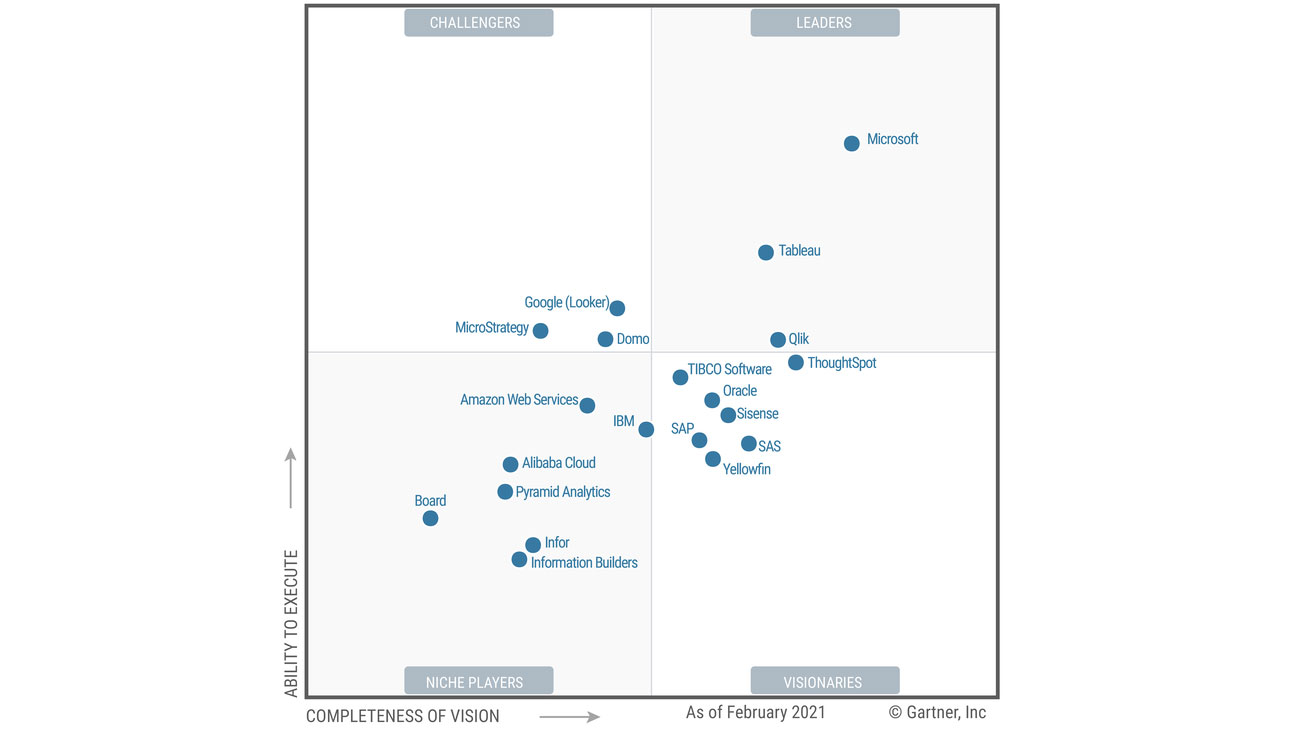
Every year, research and consulting firm Gartner conducts a large-scale study of the BI systems market. In 2021, it recognized Microsoft Power BI as a leader in its Gartner Magic Quadrant.
Microsoft Power BI is an excellent platform for smart BI and interactive reporting. It is widely considered one of the simplest, most affordable BI systems for both users and developers. Its clearest advantage is its intuitive, user-friendly interface, which helps users adapt to it quickly.
Microsoft Power BI includes three main components:
- Power BI Desktop — software for loading and transforming data, building a data model, and developing reports
- Power BI Mobile — an application for viewing reports on mobile devices
- Power BI Service — a SaaS cloud service for publishing and configuring automatic report updates, and authorizing users to access them
Working in Power BI comprises several stages:
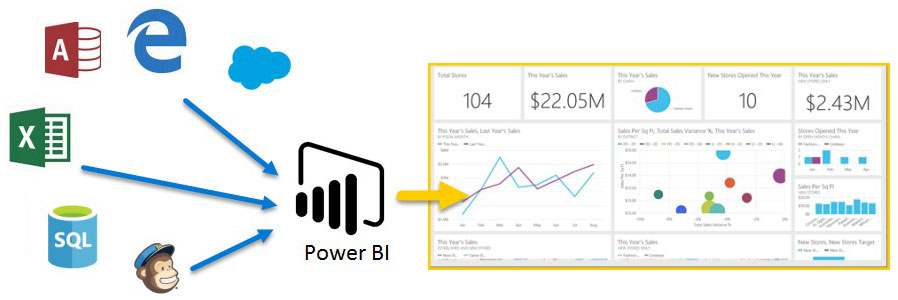
- Unloading data from various sources using built-in connectors
- Preparing, transforming, and unifying data in Power Query
- Building a data model
- Calculating required indicators, metrics, and KPIs using DAX query language, and then visualizing them by developing reports
- Publishing reports on the portal for sharing with business users
A special feature of Power BI is its built-in artificial intelligence (AI) capabilities, which do not require writing any code. Examples include:
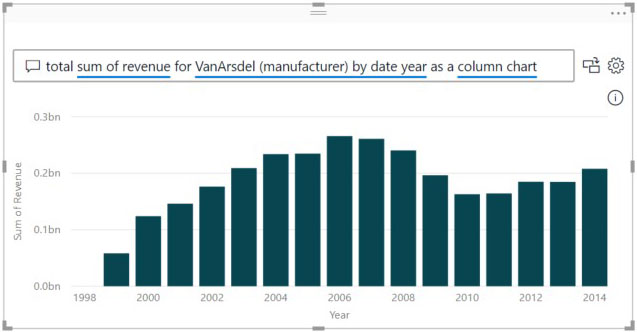
1/ Q&A — allows users to ask questions and get answers about their data in natural language
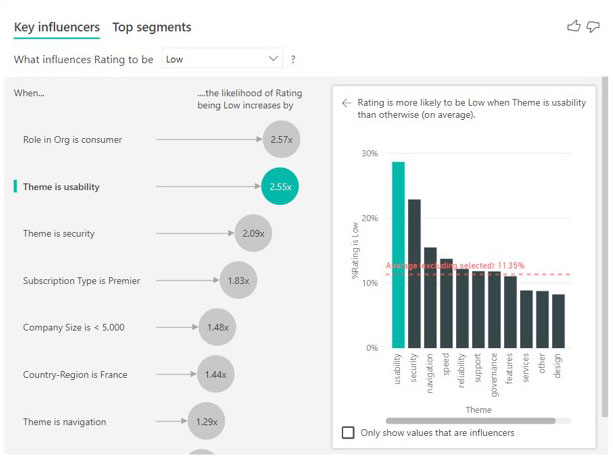
2/ Key Influencers — helps users determine which factors influence which metrics
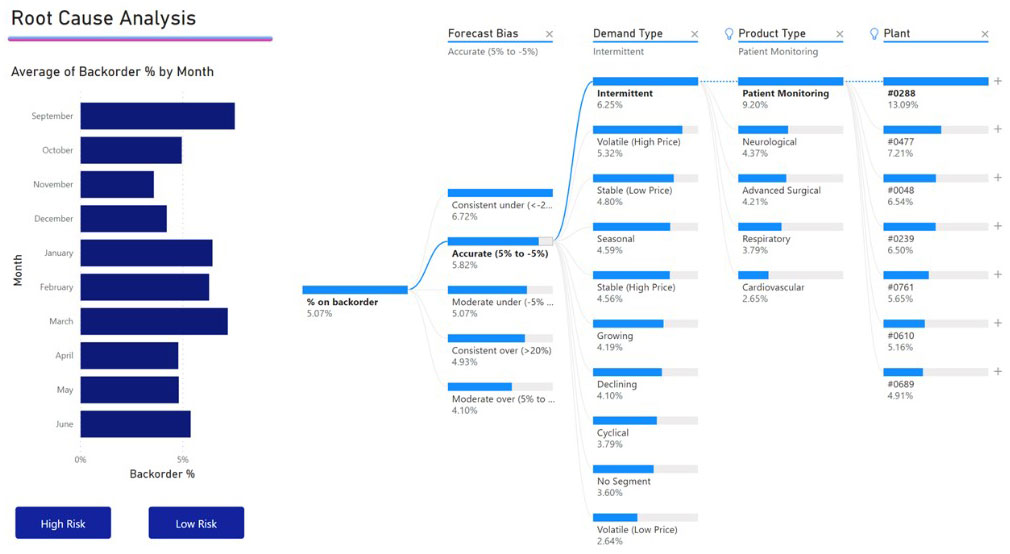
3/ Decomposition Tree — allows users to visualize data in multiple dimensions, first aggregating the data, and then detailing dimensions of interest to determine root causes
Today, Power BI offers three types of licensing: Free (basic, suitable for beginners); Pro (allows you to scale end-to-end analytics to multiple users); and Premium (suitable for large organizations with a large amount of data).
In sum, Power BI is a universal and multifunctional solution that allows you to manage data, present reports, and influence business performance through key indicators, making life easier for managers and analysts.
Integrating Power BI with E-Commerce: A Case Study
Our task was to develop an analytical application using Power BI that would allow us to analyze:
- Sales dynamics
- Product procurement
- Sales strategy
- Buyer preferences and behaviors
- Marketing operations costs
- Loyalty system effectiveness
We completed these tasks through five sequential steps which achieved the goal and led to the successful deployment of the business-oriented application.
Step one was unloading data from sources (JSON and Excel files). Using the advanced editor in Power Query, we wrote a loop in the M language that collected all available orders, page by page. We downloaded product and customer data using the built-in Web connector by writing the appropriate GET requests. We connected to the Excel file directly. (It’s important to note that, for optimal data loading, you must load only those columns that will be subsequently used in calculating indicators and building the visualization.)
For step two, we used the built-in ETL functionality to transform the data. All available tables can be divided into two groups: Fact (orders) and Reference Books (goods, customers, questionnaires). First, we determined the correct data type for each column. Then, using data profiling tools, we checked the frequency and distribution of values in each of the columns, made sure that there were no outliers in the data, replaced the blank values in the reference books with the default “Unknown” (in fact, with 0) to make our KPI calculations valid, and removed blank lines. To analyze data for relevant time periods, we built a calendar using DAX, based on an array of dates from the “Orders” table.
In step three, we defined relationships between tables and built a data model. We created a “snowflake” pattern:
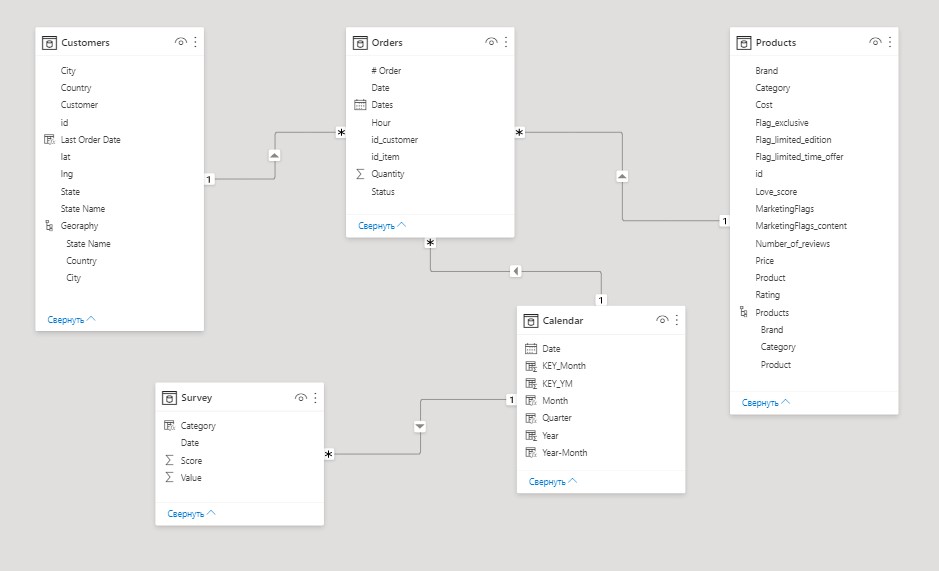
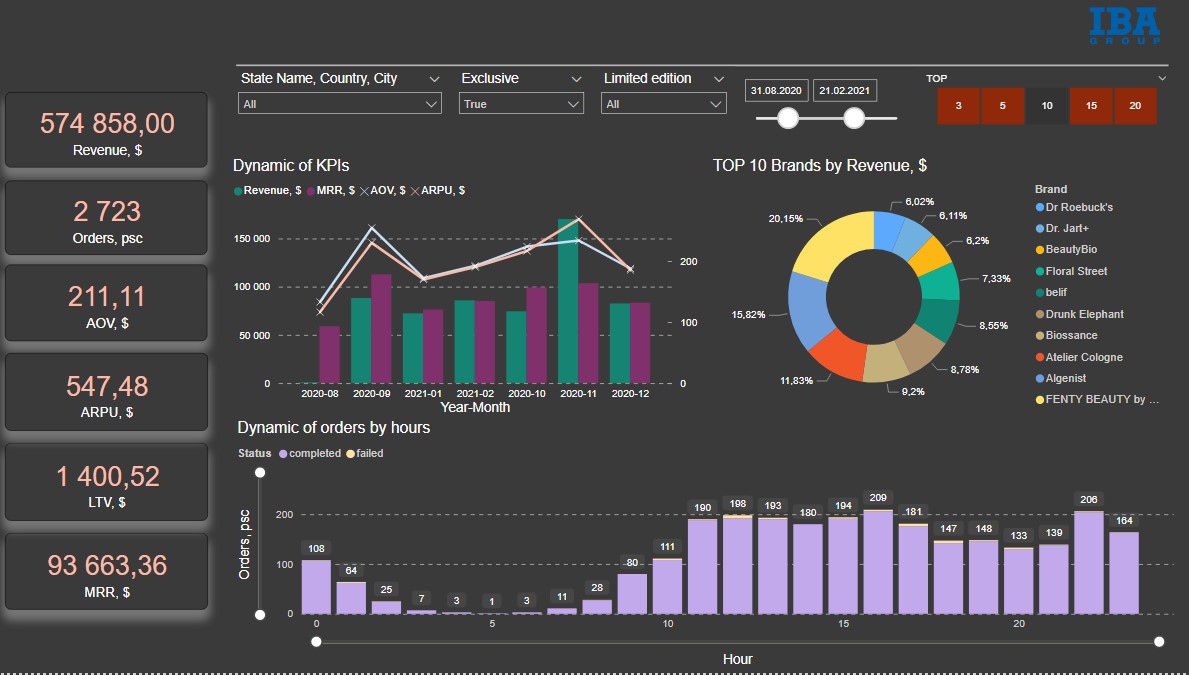
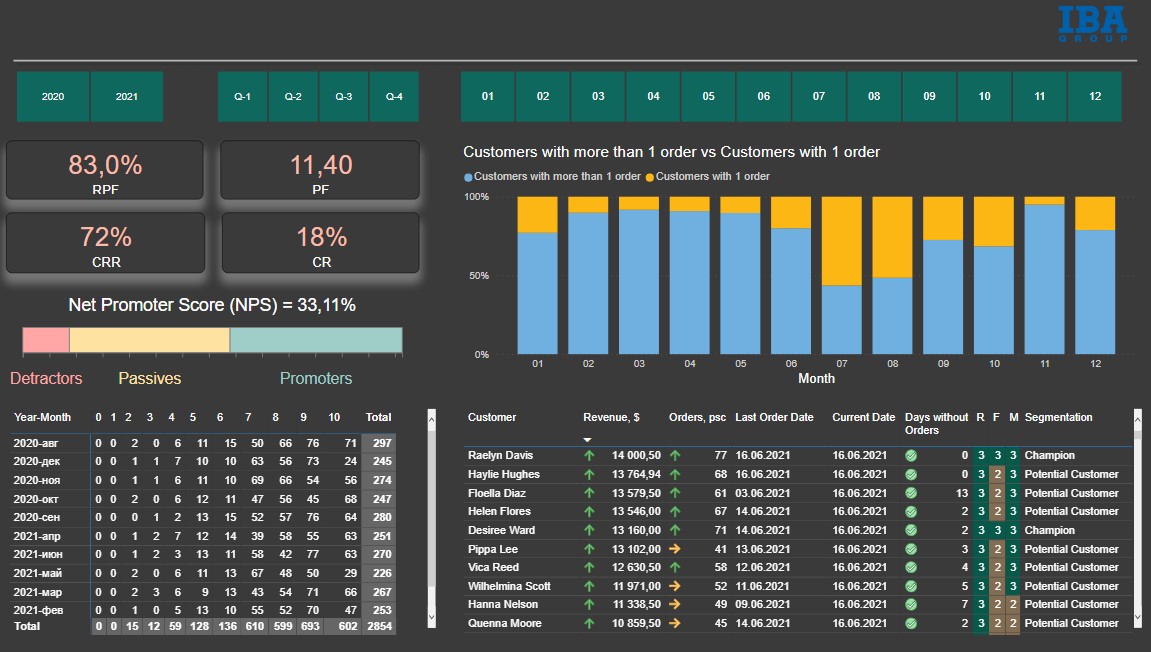
By step four, it was necessary to calculate the indicators and present them to the user in various visualizations (KPI cards, line and column charts, pie charts, pivot tables, etc.). So, we built two interactive reports: Retail Analysis and Customer Analysis. The first dealt with the analysis of sales indicators in time and categorical terms, while the second report demonstrated the behavior and loyalty of the client over time.
Finally, in step five, we uploaded the analytical application to the corporate cloud using Power BI, access to which we configured for certain users. Additionally, we set a daily overload schedule.
One of the main KPIs for online sales is the percentage of Lifetime Value (LTV). It shows the profit that the customer brings to the company for the duration of the engagement. If the percentage of LTV is low, it is worth considering ways to increase it. Tactics include email newsletters notifying customers of special offers and sales, up-sales, and cross-selling.
Increasing revenue relies on attracting new customers, but you should not forget about your regular ones. Without paying due attention to them, you could face an outflow of customers. You must remember that a regular customer means more revenue than a new one. To determine a company’s ability to maintain a long-term relationship with a customer, it is necessary to calculate factors like Customer Retention Rate (CRR), Churn Rate (CR), Repeat Purchase Rate (RPR), and Purchase Frequency (PF). To motivate customers to buy more often, you need to arrange promotions and sales.
To assess customer satisfaction, you need to conduct surveys. Email and/or SMS questionnaires will help you determine your Net Promoter Score (NPS), a key indicator for customer loyalty. If NPS is low, it means refining your approach to each client group.
In the past, preparing reports meant a lot of manual labor, and low efficiency. By introducing our analytical solution, many of the company’s business processes were automated, boosting data processing and decision-making speed.
The resulting analytical system has all the necessary sections which can be analyzed with different levels of detail. They can get as specific as viewing a specific SKU or customer. It also contains functionality aimed at understanding the buying behavior model. The calculated RFM analysis allows managers to segment clients according to potential clients and current revenue producers, then helps generate individualized approaches to each client that stimulate frequent, high-value purchases. This will increase the company’s overall profitability.
Based on sales figures, managers can determine which brand or product category is in demand, the seasonality of goods, peak time for orders during the day, the average bill for each client, and variations in monthly revenue.
Good BI helps you make smarter decisions based on current and historical data. With just a few clicks, you can see the frequency of customer purchases, assess purchasing power, and thus easily categorize customers to develop further engagement and retention strategies.
One of the advantages of our solution is the speed at which we calculate indicators, rebuilding tables and graphs with the ability to instantly save, print, and send readymade reports by email. Our application allows multiple daily data updates.
All in all, the analytical application we developed for this client allowed them to study their data more effectively, analyze their e-commerce activity more quickly and easily, and reveal hidden trends in their business over time. It gave them a competitive advantage, ensured sales growth, allowed the creation of a meaningful marketing policy, improved the quality of decisions, and catalyzed a deeper understanding of their clients.
Conclusion
With a suitable development tool, you can effectively analyze data in both aggregate and detailed form, all while identifying problem areas. With reliable data, managers can solve strategic and operational tasks more efficiently. To leverage the full potential of your business, look no further than IBA Group.