Analytics vs. Reporting — Is There a Difference?
Table of contents
In short, yes, there is. Anyone who knows the difference between analytics and reporting will register (and get irritated) whenever the word “report” is used improperly — for instance, while developing, implementing, and supporting a business intelligence (BI) system.
It may seem like a semantic issue, as many people use both terms interchangeably. But I will insist that, no, the two definitions are dramatically different. In this article, I explore the difference — I’m just one of those people who wince after hearing “Let’s make a new report.”
Analytics is Not Reporting
Let’s start with the small pop quiz: Which does the table below represent, reporting or analytics?
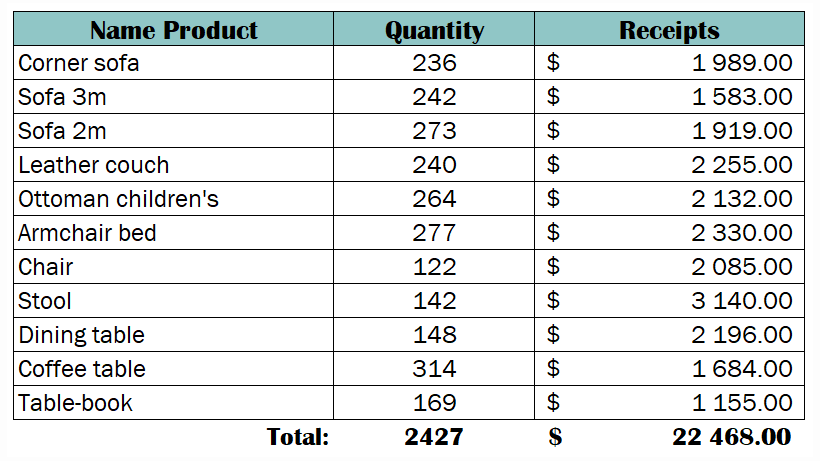
When I pose this question, people tend first to doubt themselves. Then, someone jumps in with, “Analytics!” (after all, Excel remains an indispensable BI product for many). Then, someone else says, “Reporting!” But the real question is, “Does the indicator 2,427 mean ‘a lot’ or ‘a little’?”.
Only after that, people start thinking more deeply.
Some folks don’t know how to evaluate this or other indicators. They only ask, “How would I know?” (This is where I realize that the company’s data literacy is quite low.)
How do you evaluate “a lot” vs. “a little”? You guessed it: You need an object of comparison. In the above example, you’d want to compare it to the data from the preceding year. Say the figure from that year was 2,200. Now, is 2,427 “a lot” or “a little”? Because it’s a bigger number, it may seem like 2,427 is “a lot,” but in reality, there’s still no definite answer. Last year, we could have had 10 points of sale, and had 15 this year. That is, places of sale could have increased by 50% while total sales only increased 10.3%. Do you still think it’s “a lot”?
Now imagine there were 12 points of sale last year, and only 10 this year. Does it mean we began to sell better in general? Or, did overall demand increase? Or, did we introduce a new product that everyone liked? Did a competitor leave the market, making more room for us? Was a new talented consultant hired at some point of sale? The standalone table above answers none of these questions.
In reality, the “a lot” or “a little” question was a bit of a trick question. That’s because, considering the second question, the first answer doesn’t really matter. The second question is, “Why?” Why is it “a lot” or “a little”? Why is this indicator at a given time more or less than the previous value?
We’ve arrived at the greatest difference between analytics and reporting. Analytics answers the most important question: Why?
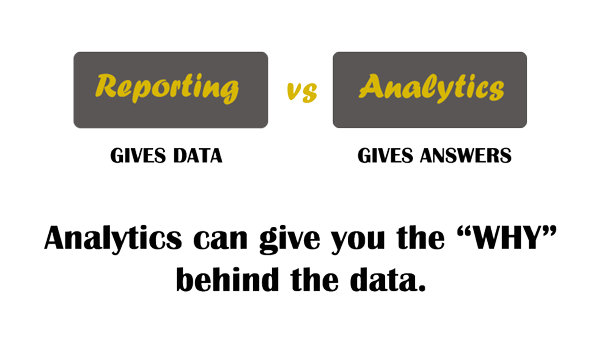
Analytics helps you see meaning in data, understand relationships between numbers, find dependencies, and finally make the right choice about how to proceed. It allows you to ask good questions and get meaningful answers. These answers are then structured and visualized in the form of reports.
The Right Management Decisions Come from Good Analytics
Staff members make management decisions every day. These decisions must be data-driven. If the company does not have a unified BI system, structured unified indicators, etc., then employees have no choice but to collect this information from the available sources and try to turn it into a meaningful basis for a decision.
It’s common that employees know they’re missing an important piece of data. They contact the IT department and ask them to unload the missing piece in a certain form. Did the IT department calculate everything correctly? Was the unloading form/resulting table/final report successful? How long did it take the IT department to prepare the information? None of these questions matter to the employees, because in the absence of a better system, they must make do with what’s available.
Can the employees manipulate this data? Can they filter or detail it? No! The obtained data is static and unknown, unreflective of the full picture. Many confuse this data with “reporting.” In reality, it’s more like an information set — unloaded raw data.
Fortunately, there’s a better way. Implement a unified BI system in the company, and give your employees access to it. It will enable them to open the application they need, gain access to more information, view sections and indicators that accurately reflect the situation, and use prepared types of analysis, report constructors, graphs, etc., double-checking calculations when necessary. Based on better, more easily accessible information, employees make better management decisions, preparing reports with answers to the questions posed in the task, and presenting them with confidence. These management decisions reflect the value of the analytics system.
Managed Experiment — The Advantage of Analytics
To illustrate the difference between analytics and reporting, let’s talk about the managed experiments that analytics enables.
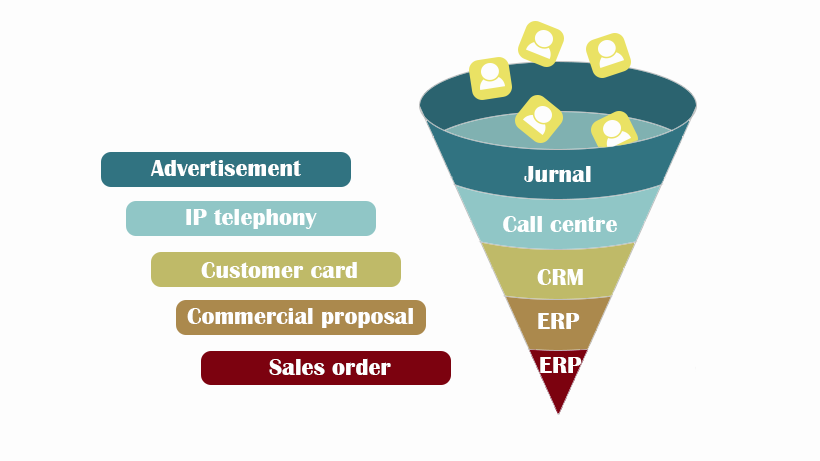
Suppose our company sells equipment to other companies in a B2B model. We have a call center that accepts calls and guides the client to a salesperson who draws up applications, then a sales manager prepares a commercial offer (CO) to the client. To attract customers, we advertise: contextual advertising, web promotions, and thematic magazine promotions.
We then want to evaluate the sales channels, as the company prefers thematic magazines and spends a lot of money on those advertisements.
Already, we have several data sources:
- A billing system for a call center, where we see what number called us and when
- A CRM system, where an application, a CO, and a sales document are formed
- An ERP system displays the financial costs of advertising for different sales channels.
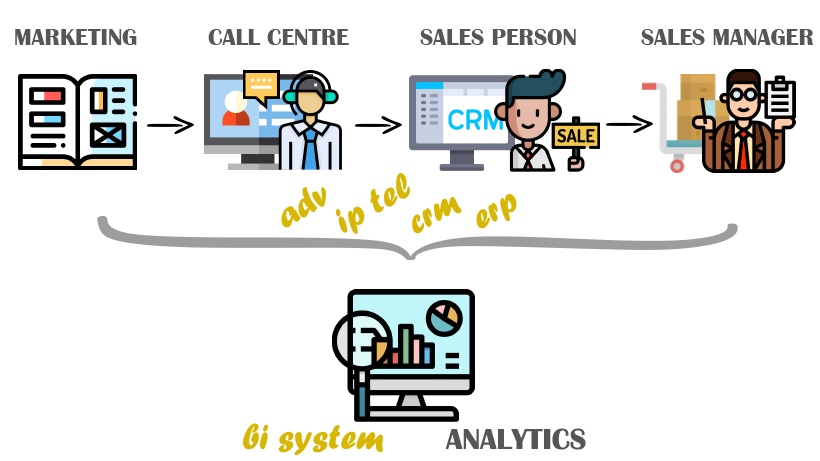
Suppose we found a new journal in which to promote our products. How would we determine whether it would bring us profit? We conduct a managed experiment, assisted by our BI system. We create a separate phone number in our IP-telephony system and post it in the new thematic magazine.
In the call center, a unified phone number is used to receive calls, then the system independently distributes them to a free operator, so the operator doesn’t know which specific number called initially. We therefore need to manipulate data from the telephony system to correlate the initial number from which they called with the number of a specific operator. The BI system allows us to manipulate the data to determine the specific number of calls from our target phone number, clearing call forwarding and redirections. Additionally, we can identify calls by specific duration.
You might say that such manipulations can be carried out by other tools. That’s true — but will those other tools be sufficient for the following scenarios?
- Outcome 1: No one called the new number even once. The funnel did not open, the sales channel is useless, and we can stop there
- Outcome 2: The new number was called. So what? Does it mean that the ad was successful? Not necessarily. It means neither effectiveness nor ineffectiveness until we compare the cost of advertising with the profit it reaped.
Let’s take it a step further. If the funnel opened when a potential client picked up the phone, then at some later stage it must close. But what stage exactly?
To track whether calls resulted in orders, the ERP/CRM systems must be connected to the call center. Here, it’s already necessary to build a whole process. During a call, a call center specialist must enter a potential buyer into the CRM with their contact details. Then, the sales team must process the request and prepare a CO for the potential customer. There may be several numbers from which the client calls and re-calls later, as well as several contact persons on the client’s side. All of this information must be combined and grouped.
After sending the CO, some time passes, during which the client either makes an order or refuses the product. But even after placing an order, it takes time to complete the payment (full or partial on credit). Therefore, it turns out that a good deal of time passes between when the client picks up the phone for the first time and when the seller receives payment. All of this data must be properly aggregated and consolidated.
Only after that can an ads manager perform meaningful analytics to compare the costs with the margin for specific transactions. It’s best to view these analytics with daily updates, dynamics, and comparisons. In the end, the manager can determine the effectiveness of this advertising channel and the success of the experiment. But more importantly, he can determine why the experiment either succeeded or failed.
The complexity of this experiment illustrates that reports from the call center’s ERP and billing system are not enough for good management decisions. Even after unloading data from the above-mentioned sources and converting it to an Excel file, what will you have? A picture of the “here and now,” but you’ll need this picture refreshed every day, for different periods, different product groups, etc. This report, which you barely prepared for the “here and now,” is very laborious and includes a high risk of errors. It’s simply not suitable for good decision-making.
For such tasks, you need BI systems. It’s like comparing a toothpick to a skewer. At first glance, both appear to be wooden sticks. But in reality, they solve different problems. You wouldn’t buy skewers to clean your teeth, and you wouldn’t buy toothpicks to bake meat rolls in the oven. But if, after dinner, you’ve got food stuck in your teeth, but no toothpicks on hand, you might use a skewer in the absence of a better option. For me, a report is a toothpick, while analytics is a skewer — skewers can both cook the meat and clean your teeth.
Questions to Help You Understand Analytics
Analytics is a science with existing analytical methodologies. For example, have you heard about the concepts of Dashboard Analytics Report (DAR) or Business Discovery?
Do you understand what signals and noise are — and how to see only signals while ignoring noise?
Do you understand which average metric should be used in this or that case — mode, median, or mean?
Do you know how to correctly display a proportion graphically in a pie chart?
Case in Point
Case 1. You are working as Chief Medical Officer in a private medical institution and need to study a new report. You must assess the conditions of patients in the hospital in the autumn-winter period. For data, you have numbered patients and temperature values.
By calculating the average temperature of patients in the hospital, you get a value of 36.3. Does the result correspond to the real situation? Let’s analyze each patient’s temperature to check.
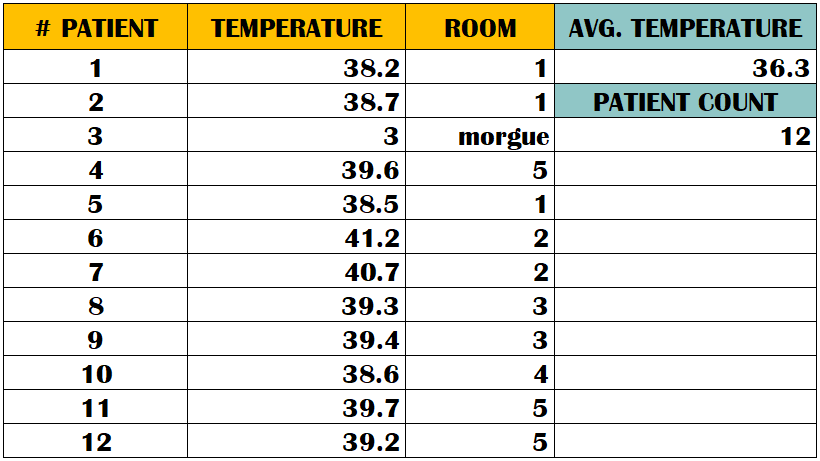
Did you notice an outlier? You need to count the average temperature wisely!
Here we see: A report without analytics is useless.
Case 2. You are an investor. A company that owns a chain of retail coffee shops asks you to invest in its business. The company provides you with its business plan, one of whose graphs displays the number of customers by day of the week. Your task: Look at the schedule, and assess the situation.
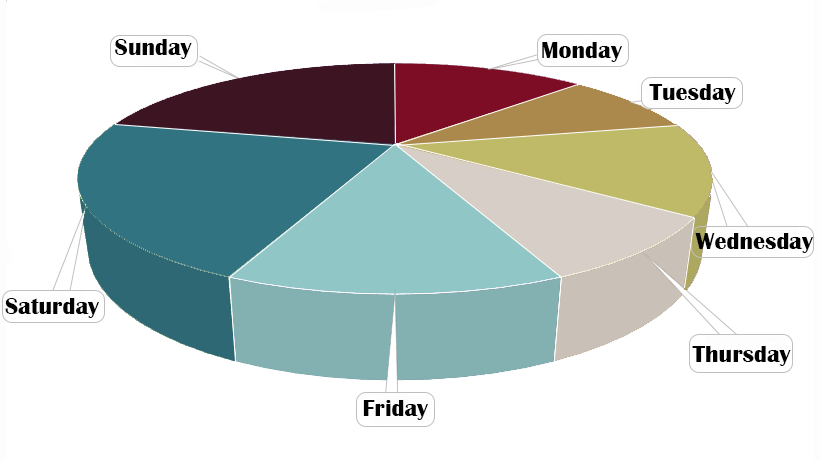
Judging by this graph, many would say that the largest influx of people is from Friday to Saturday. On Monday, Tuesday, and Wednesday the traffic is approximately equal, while on Tuesday it hits its lowest level.
But, I say, “Cheating!” Let’s make a couple of magic moves to improve this graph:
1. Add numbers. Usually, numbers are small, and many don’t see the discrepancy.
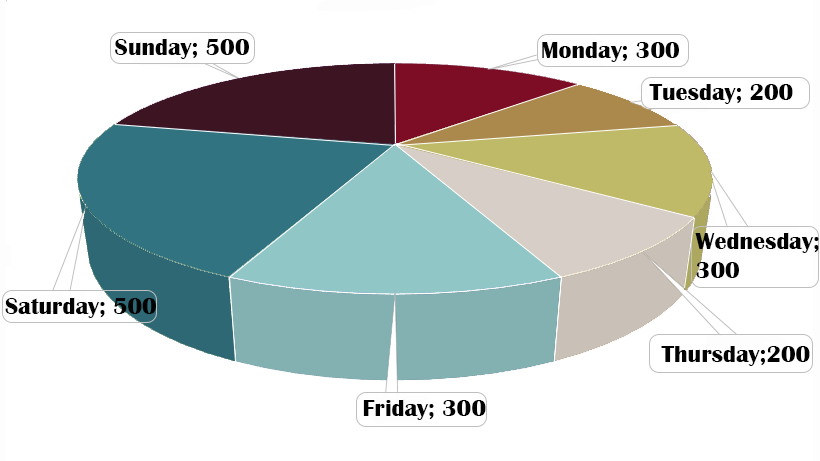
2. Make the graph flat.
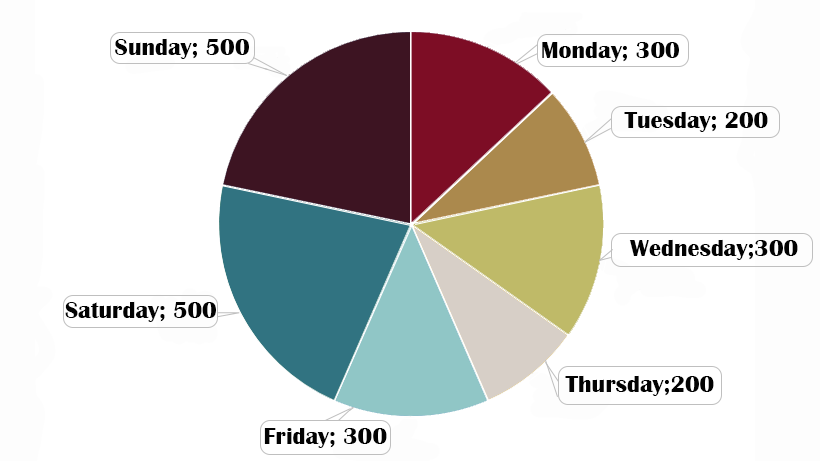
Has your verdict changed?
The above examples demonstrate that, very often, people see what they want to see, missing crucial information. The condition of the patients in the hospital is excellent, and the temperature is close to normal. Weekend and Friday attendance is excellent, which is what you’d expect from an HoReCa company. To avoid misinterpretations, BI experts not only provide the correct data but visualize it clearly.
Will reports alone help management make the right decisions? Of course not! The definition of “analytics” says that it is the combination of data and information for meaningful decision-making.

Many of our clients believe they have everything they need for analysis…until we discuss it with them.
- We agree that the systems’ built-in reports (e.g.: ERP, CRM, project management systems, and others) are very useful and necessary for day-to-day work. However, the purpose and tasks of such reports are completely unrelated to data analysis. They function better as informational references, rather than a source of answers to the question, “Why?”
- We also agree that reports must exist. Still, we are deeply convinced that they must coexist with analytics, and stand as its logical continuation.
Any BI system can prepare a report. Technologically, it will be much faster, easier, and more convenient than making a report manually or generating data unloadings — or even waiting until the automated request is processed. BI tools will never leave you without reporting.
Our Experience
We have witnessed many situations where companies were staffing entire departments responsible for making reports in manual or semi-manual mode. Then, after we implemented a BI system, we automated all the reporting that these departments had handled. Departments of 20 people turned into departments of 2 experts.
Let’s look at a couple of drawbacks of relying entirely on reporting:
- The human factor. When combining data, people can make mistakes, get distracted, and forget things.
- Time and effort. I often tell clients, take a person or department who handles reporting, multiply his salary by 12 months (or years), and see how much it costs to prepare reports in manual/semi-manual mode. BI systems are smarter, are implemented with one-time fees, and automate the entire process. Human resources can then be leveraged for more creative, interesting work.
- Attrition. What happens when one specialist, who has been making a report for years, suddenly leaves the company? The company’s ability to build this report vanishes with this specialist. Not so with BI systems.
- Hidden Figures. Do you know how much is hidden behind the pages of reports? If employees’ compensation is based on the efficiency of their work, you’ll always get a “beautiful” report with “correct” numbers on your table, and all mistakes will remain “behind the scenes.”
During one BI implementation, we compared figures for the indicator “inventory turnover” in the category “>999 days.” We were surprised by how many goods showed up there. We approached the client with a request for a report from his system. The report we received contained neither such figures nor such goods. After a short investigation, we found that for more than four years, the client’s warehouse had been storing five tons of expired canned food.
Moreover, for all those years, the client had been paying for the warehouse rent, electricity, etc. We also found that several boxes of expensive cognac and other goods had been stolen from the store. However, since all these problems fell on the shoulders of employees in the form of deductions from salaries, they had been ignoring these products in reports for years. They just erased this data from the reports by using special filters. Only after the deployment of our BI system did the entire picture become clear. - And finally, Order of Operations. I’m always telling everyone: You don’t analyze the data in the report, you build a report based on analytics! Only then can each of these concepts do what they were intended to do.
You may also be interested in
- Data Literacy: The ABCs of Business Intelligence
- Unsuccessful examples of BI development. Part I
- Examples of Unsuccessful BI Development, Part II
- BI Tools Comparison: How to Decide Which Business Intelligence Tool is Right for You
- BI Implementation Plan
- IBA Group Tableau Special Courses
- Integrating Power BI into E-Commerce: How to Succeed in Rapidly Developing Markets